The Brief for our Project titled Aligning Signs, was to design and produce a graphical data visualisation to be projected onto the façade of the LCC.
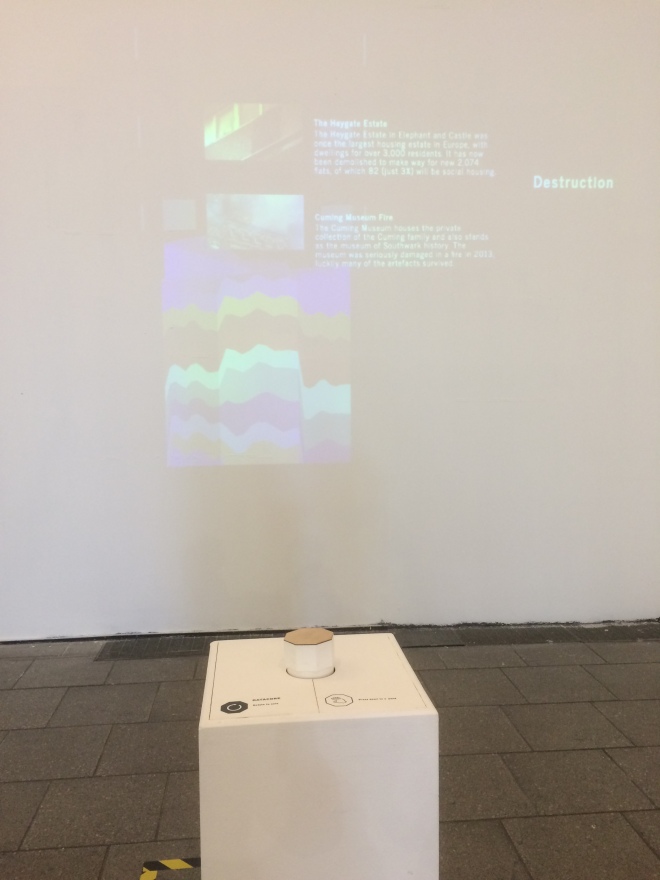
After a short initial discussion talking about what exactly Is a data visualisation and the ways information is shown and displayed we where taken to the façade. The exhibition was to show and display infographics about the local area in Elephant and Castle as well as the History behind it. This directly correlates with our brief as one of the specifications of the brief was to design based on the local area of Elephant and Castle, or if we desired to expand further London as a whole. One of the examples they showed us displayed various information about the history as well as categories, which was displayed around a polygon which could be controlled via a button on a pedestal. The user interaction of the visualisation was simple and quick to understand, you could turn it to look at different topics and sections and then press down to see further information about a specific topic. One of the points I noted was that its shape was similar to what was displayed so they could link it to the display so as a user you could tell what it was for, furthermore it had instructions on the pedestal to explain further how the button works if more help was required. Another example used live data from transport for London.

We as a group came up with a few ideas taking influence from current design work displayed in the façade of the LCC. This helped establish a basis for what directions we could explore, and the possibilities and resources we could use for when we create our own graphical data visualisation piece.
My original idea was based around the police in terms of tracking were certain police force are in the area, for examples if there are hazards or emergencies. The other idea that was to create a design based on the growth in the music industry looking at either attendance or other criteria to look at.
Exploring further into the idea around the music industry as we felt we could gain information about Night Clubs easier than that of getting information on police which they after researching further are not allowed to give out, furthermore one of the members in our group has worked in clubs so has inside knowledge about how nightclubs work.
Visual Interactive Exemplars – Wednesday 5th October
I researched into different types of infographics and designs to gather ideas on how I could create the piece for our group and what possible designs we could do a produce. Furthermore, how other examples produce their work.

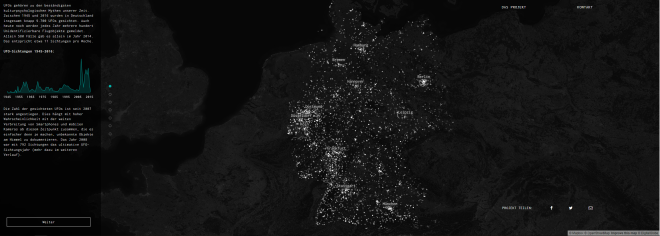
Link for Above Infographic:
This example in particular I liked as it although being unable to understand it I could still work out what purpose each section was for, for example having the main information central with any supporting text to the side. Due to the large sample size ranging from 1945-2016 you can work out that its a map of Germany due to all the points from the Alien sightings. This idea and look I wanted to try to incorporate into a possible design idea, for our project as we decided to focus on night clubs.
Further Links for Infographics I researched Into:
https://www.nyi.net/5-awesome-interactive-data-visualizations/
http://armsglobe.chromeexperiments.com
http://www.evolutionoftheweb.com
http://www.siegemedia.com/creation/best-infographics
http://www.informationisbeautiful.net/visualizations/worlds-biggest-data-breaches-hacks/
https://www.theguardian.com/world/ng-interactive/2014/aviation-100-years
http://www.google.com/insidesearch/howsearchworks/thestory/
http://www.downgraf.com/wp-content/uploads/2013/04/brief_introduction_typography.jpg
http://dingo.care2.com/pictures/greenliving/uploads/2015/09/creative-routines-edit4.png